
What is Anomaly Detector?
Anomaly Detector is an AI service with a set of APIs, which enables you to monitor and detect anomalies in your time series data with little ML knowledge, either batch validation or real-time inference.
Features
With the Anomaly Detector, you can either detect anomalies in one variable using Univariate Anomaly Detector, or detect anomalies in multiple variables with Multivariate Anomaly Detector.
| Feature | Description |
|---|---|
| Univariate Anomaly Detector | Detect anomalies in one variable, like revenue, cost, etc. The model was selected automatically based on your data pattern. |
| Multivariate Anomaly Detector | Detect anomalies in multiple variables with correlations, which are usually gathered from equipment or other complex system. The underlying model used is Graph attention network. |
What is Univariate Anomaly Detector?
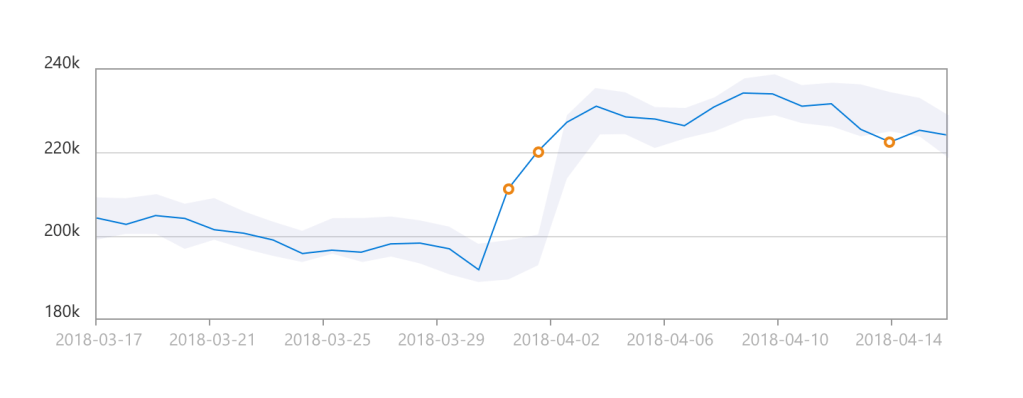
The Anomaly Detector API enables you to monitor and detect abnormalities in your time series data without having to know machine learning. The Anomaly Detector API’s algorithms adapt by automatically identifying and applying the best-fitting models to your data, regardless of industry, scenario, or data volume. Using your time series data, the API determines boundaries for anomaly detection, expected values, and which data points are anomalies.
What is Multivariate Anomaly Detector?
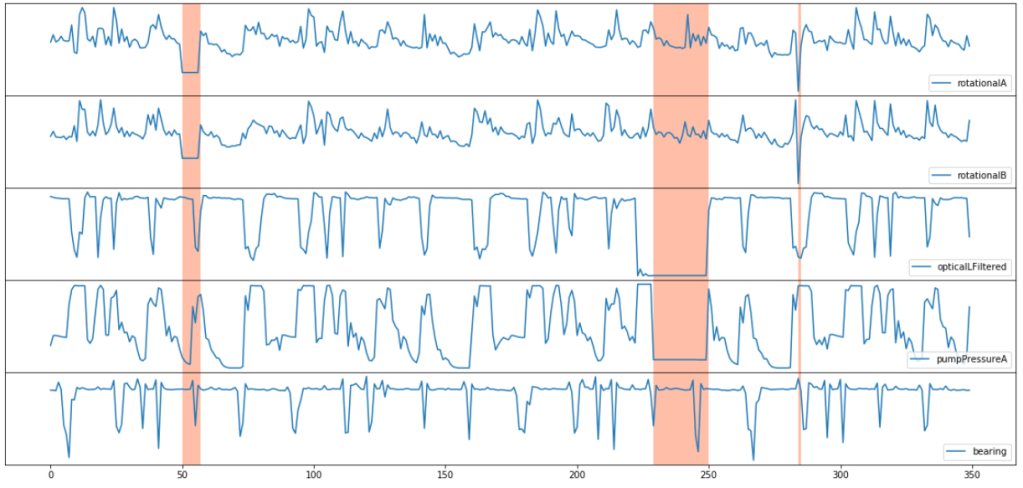
The multivariate anomaly detection APIs further enable developers by easily integrating advanced AI for detecting anomalies from groups of metrics, without the need for machine learning knowledge or labeled data. Dependencies and inter-correlations between up to 300 different signals are now automatically counted as key factors. This new capability helps you to proactively protect your complex systems such as software applications, servers, factory machines, spacecraft, or even your business, from failures.
When to use Univariate Anomaly Detector v.s. Multivariate Anomaly Detector
If your goal is to detect anomalies out of a normal pattern on each individual time series purely based on their own historical data, use univariate anomaly detection APIs. For example, you want to detect daily revenue anomalies based on revenue data itself, or you want to detect a CPU spike purely based on CPU data.
If your goal is to detect system level anomalies from a group of time series data, use multivariate anomaly detection APIs. Particularly, when any individual time series won’t tell you much, and you have to look at all signals (a group of time series) holistically to determine a system level issue. For example, you have an expensive physical asset like aircraft, equipment on an oil rig, or a satellite. Each of these assets has tens or hundreds of different types of sensors. You would have to look at all those time series signals from those sensors to decide whether there is system level issue.

Leave a comment